Pictures
The water, the gate, and the gullies — photographed.
Photographs of this flooding exist: the water at Drake and Donahue, the gate at the pond, the gullies above Golden Gate Village. They are scattered through agency reports that run to hundreds of pages. Here they are, each cited to its document, figure number and page, with a link to the original.
All but the four photographs at the end are from public agency documents, which is why they can be shown here; those four are our own work, and say so. Nothing has been altered beyond cropping and resizing. What is left out, and why, is explained at the foot of the page.
Marin City Stormwater Plan
Schaaf & Wheeler, for the Marin County Flood Control and Water Conservation District · October 2025
California public record · the document ↗
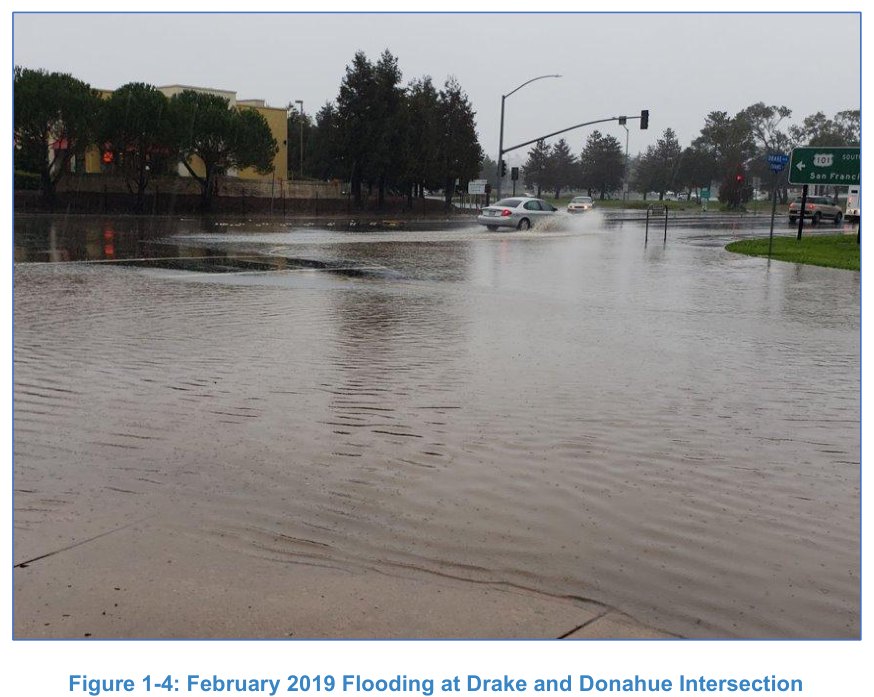
Figure 1-4: February 2019 Flooding at Drake and Donahue Intersection
Marin City Stormwater Plan, p. 4. Schaaf & Wheeler, for the Marin County Flood Control and Water Conservation District, October 2025.
The corner this whole site is about, under water, with cars driving through it. Everything the model says about Drake and Donahue is an attempt to describe this photograph.
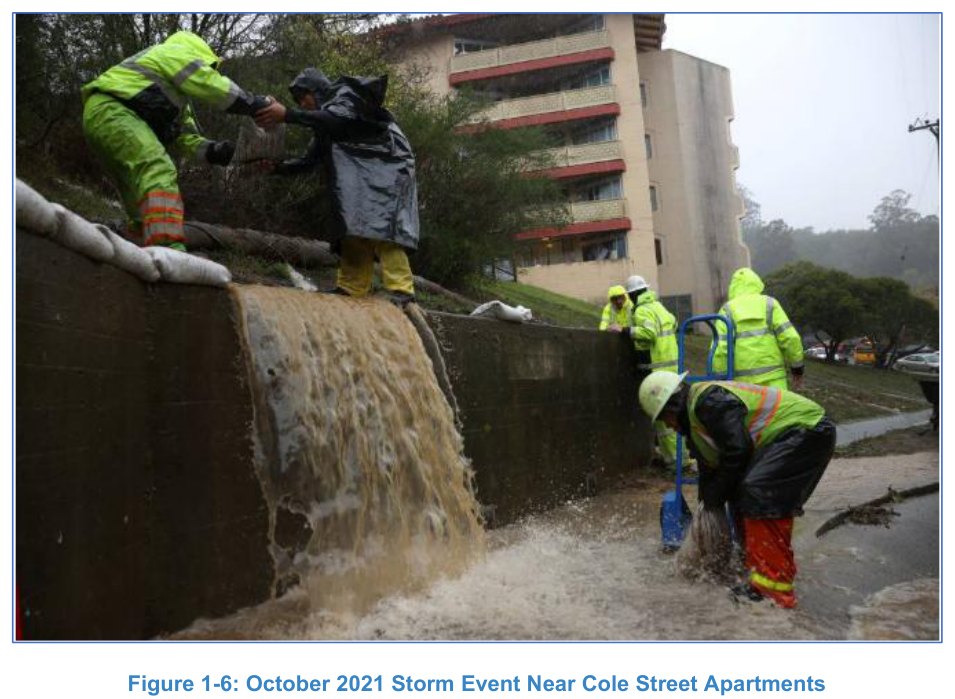
Figure 1-6: October 2021 Storm Event Near Cole Street Apartments
Marin City Stormwater Plan, p. 6. Schaaf & Wheeler, for the Marin County Flood Control and Water Conservation District, October 2025. Photograph credited in the document to Chinaka Green.
Brown water pouring over a wall while crews sandbag it. The brown is most likely sediment: the material the People's Plan traced to the gullies above the neighborhood, and the material that silts the pond.
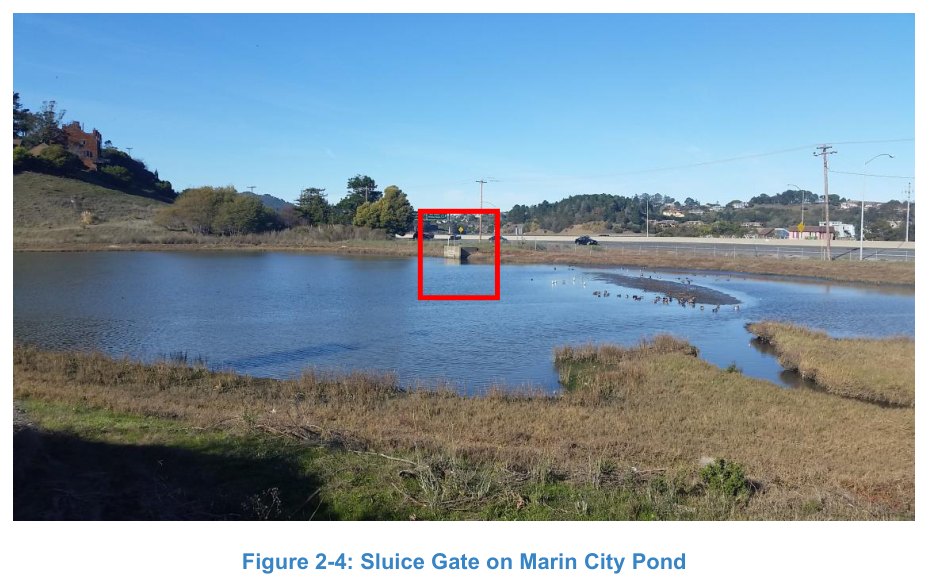
Figure 2-4: Sluice Gate on Marin City Pond
Marin City Stormwater Plan, p. 32. Schaaf & Wheeler, for the Marin County Flood Control and Water Conservation District, October 2025.
The gate. Everything on this site turns on whether this is open or shut, and the county's own photograph is the only published picture of it this project has found.
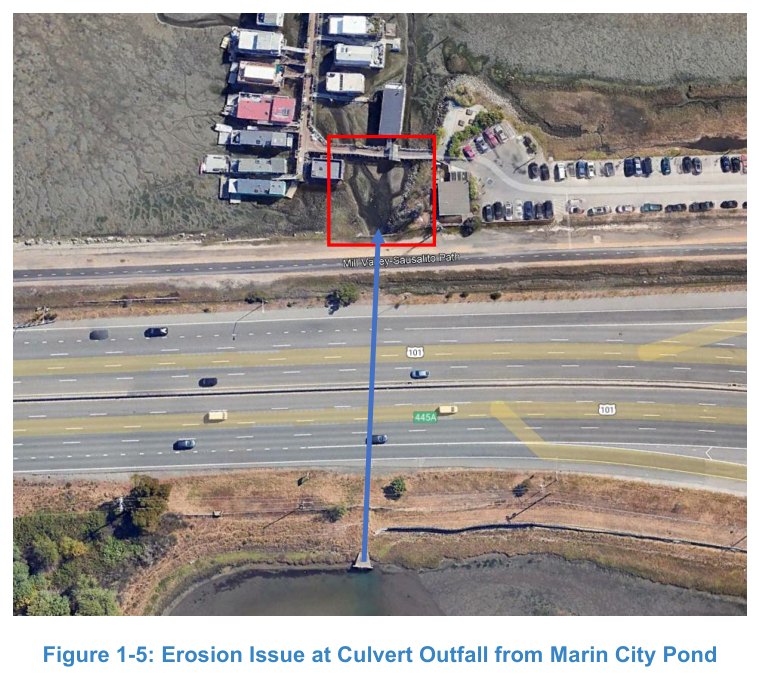
Figure 1-5: Erosion Issue at Culvert Outfall from Marin City Pond
Marin City Stormwater Plan, p. 5. Schaaf & Wheeler, for the Marin County Flood Control and Water Conservation District, October 2025.
Drawn over aerial imagery whose own license this project has not traced.
The far end of the culvert (the pipe that carries the pond out under the highway), where it empties beside the floating homes. The plan says the water rushing out at low tide digs away the channel bottom here; engineers call that scour.
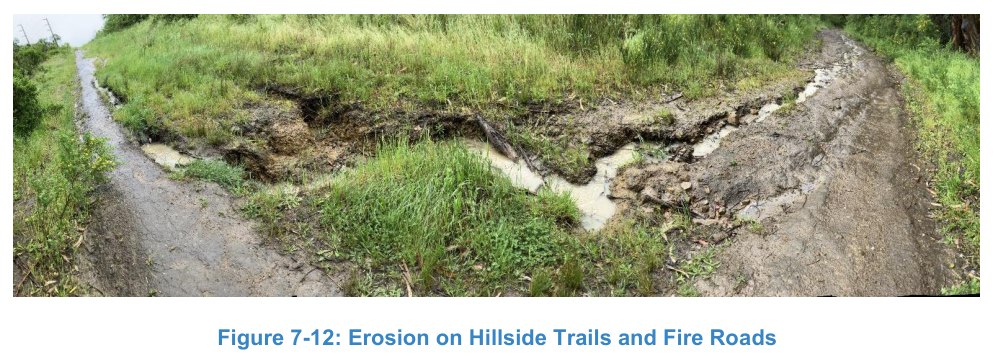
Figure 7-12: Erosion on Hillside Trails and Fire Roads
Marin City Stormwater Plan, p. 84. Schaaf & Wheeler, for the Marin County Flood Control and Water Conservation District, October 2025.
The top of the watershed, cut into by its own runoff. This is where the sediment starts, and it is the one recurring idea across all the studies with no funded project behind it.
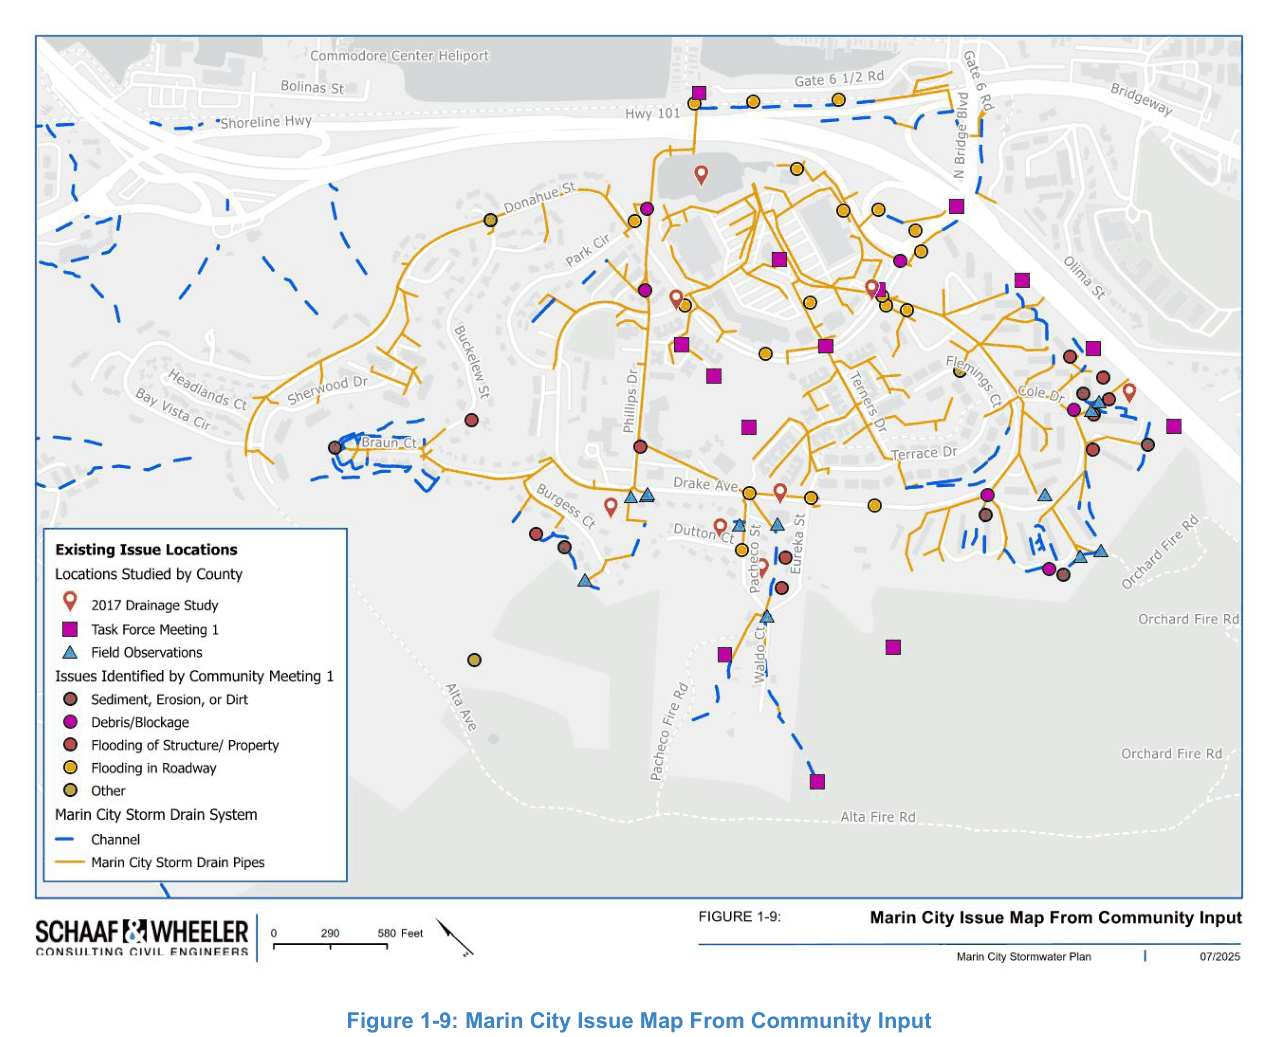
Figure 1-9: Marin City Issue Map From Community Input
Marin City Stormwater Plan, p. 9. Schaaf & Wheeler, for the Marin County Flood Control and Water Conservation District, October 2025.
Residents' own account of where the problems are, mapped. Each symbol is somewhere somebody said something goes wrong. It is the most under-used picture in any of these documents.
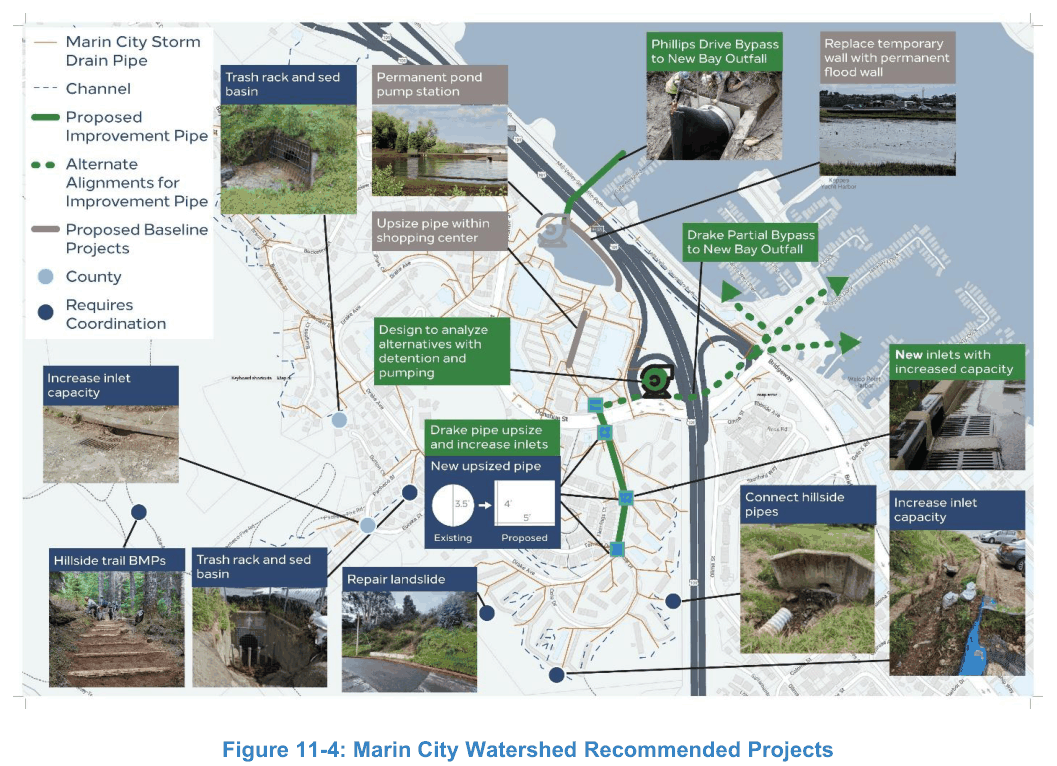
Figure 11-4: Marin City Watershed Recommended Projects
Marin City Stormwater Plan, p. 119. Schaaf & Wheeler, for the Marin County Flood Control and Water Conservation District, October 2025.
Drawn over aerial imagery whose own license this project has not traced.
The county's whole recommendation on one sheet, upper watershed and lower, with photographs of each problem attached to its location.
Marin City Flood Risk Management Study, Section 205 (CAP)
US Army Corps of Engineers, San Francisco District · 2025
US federal government work, not subject to copyright · the document ↗
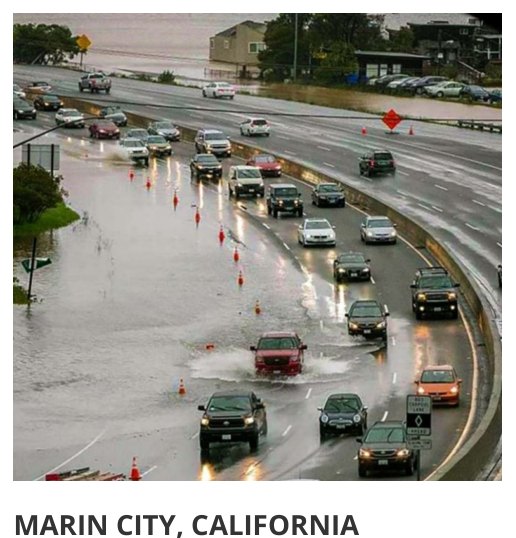
Project sheet photograph: Flooding on the highway at the Marin City interchange
Marin City Flood Risk Management Study, Section 205 (CAP), p. 1. US Army Corps of Engineers, San Francisco District, 2025.
Caltrans counts three closures of the Marin City entrance since October 2014, and the Army Corps records storms in 2017 and 2021 that left residents unable to get in or out. Donahue Street is the only route.
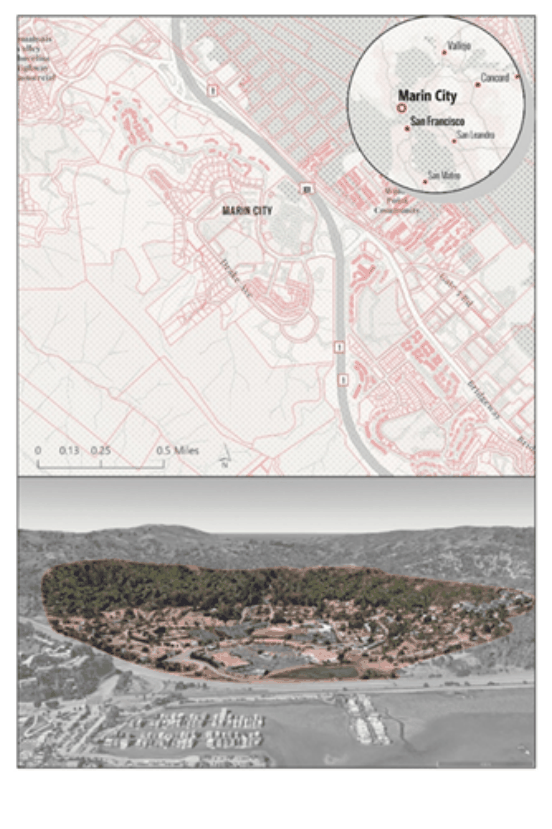
Project location map: Marin City Flood Risk Management Study project location
Marin City Flood Risk Management Study, Section 205 (CAP), p. 1. US Army Corps of Engineers, San Francisco District, 2025.
The study area for the $15 million federal study. Its local partner (the Army Corps calls this the non-federal sponsor) is the Marin City Community Services District, Marin City's own elected board.
Marin City Second Culvert Project, Draft Initial Study / Mitigated Negative Declaration
Caltrans District 4 · 2025
California public record, circulated for public review under CEQA · the document ↗
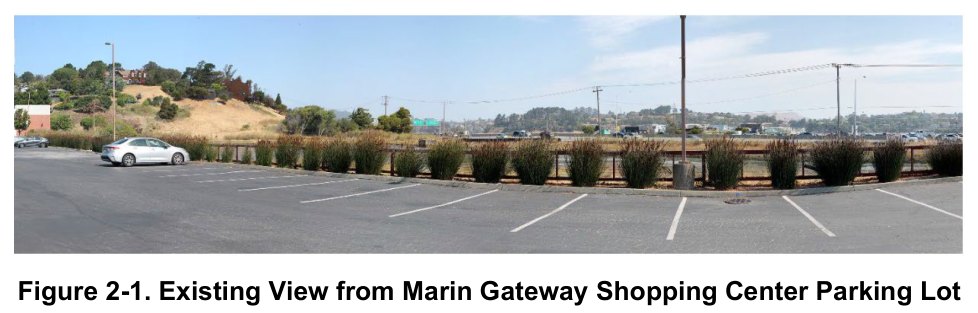
Figure 2-1: Existing View from Marin Gateway Shopping Center Parking Lot
Marin City Second Culvert Project, Draft Initial Study / Mitigated Negative Declaration, p. 2-40. Caltrans District 4, 2025.
Acres of paved parking lot between Drake and Donahue and the pond, looking toward the embankment. On a dry day.
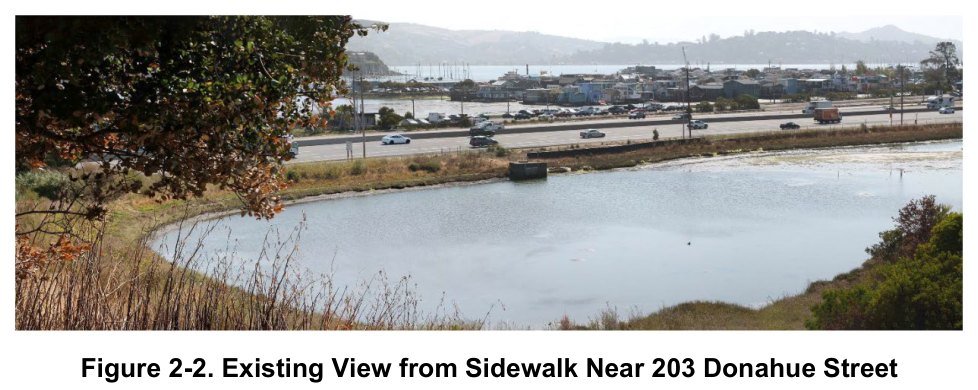
Figure 2-2: Existing View from Sidewalk Near 203 Donahue Street
Marin City Second Culvert Project, Draft Initial Study / Mitigated Negative Declaration, p. 2-40. Caltrans District 4, 2025.
The pond, from the street. Compare it with the Street View panels on the model page and with the section on why it floods — this is the floor of the bowl.
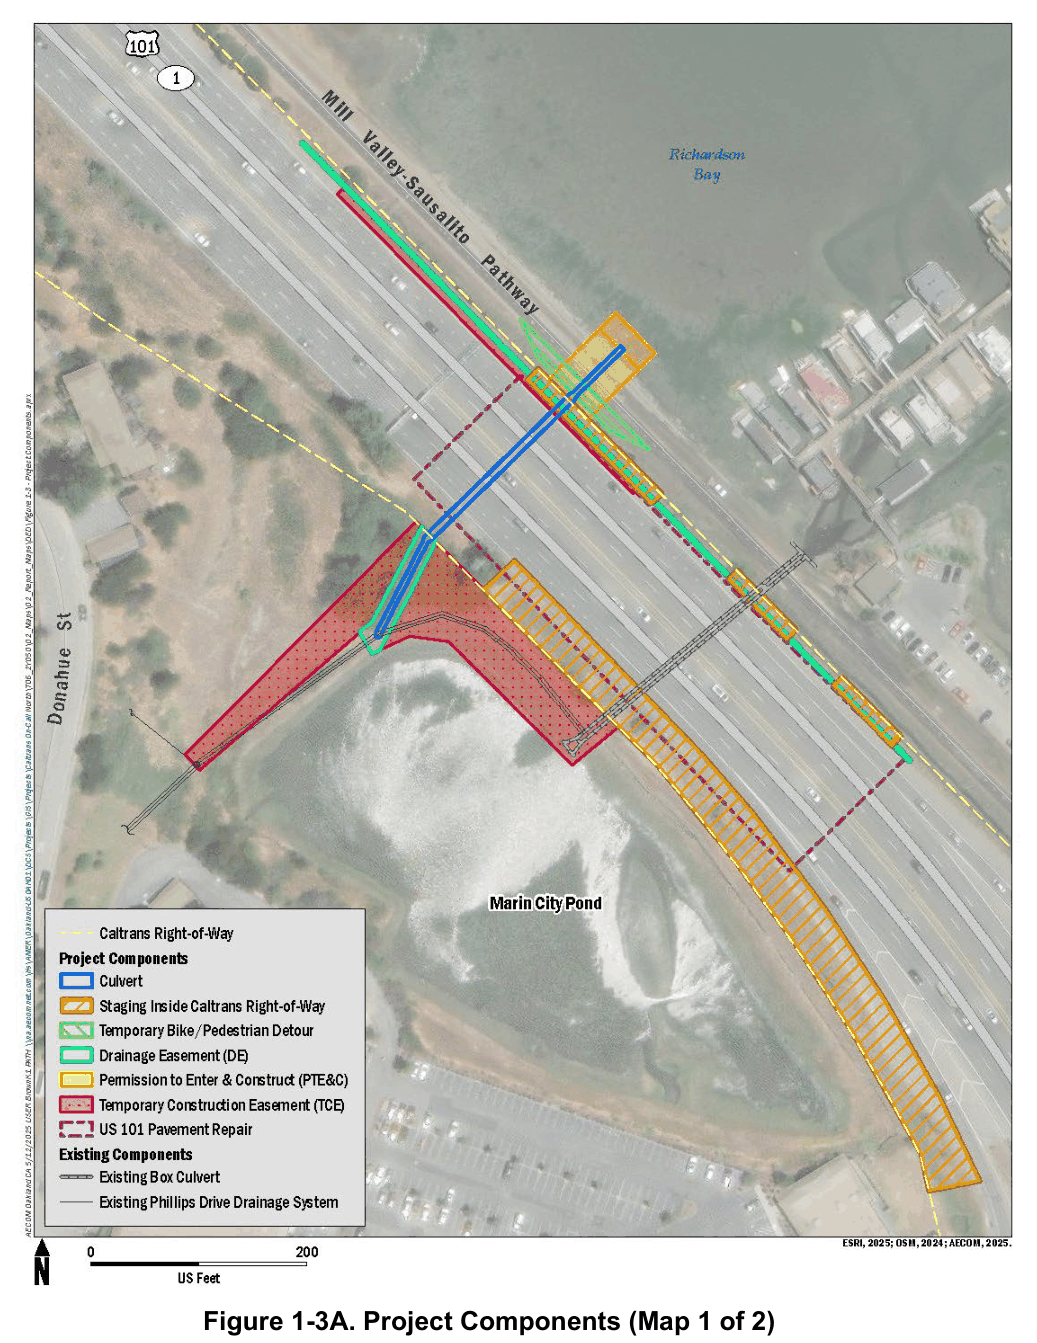
Figure 1-3A: Project Components (Map 1 of 2)
Marin City Second Culvert Project, Draft Initial Study / Mitigated Negative Declaration, p. 1-10. Caltrans District 4, 2025.
Drawn over aerial imagery whose own license this project has not traced.
The bypass, drawn. The Phillips Drive drain is rerouted away from the pond's culvert into a new concrete box of its own under the highway — which is why this project is not a second way out for the pond.
Marin City Drainage Study
Wood Rodgers, for Marin County Flood Control Zone No. 3 · January 22, 2018
California public record · the document ↗
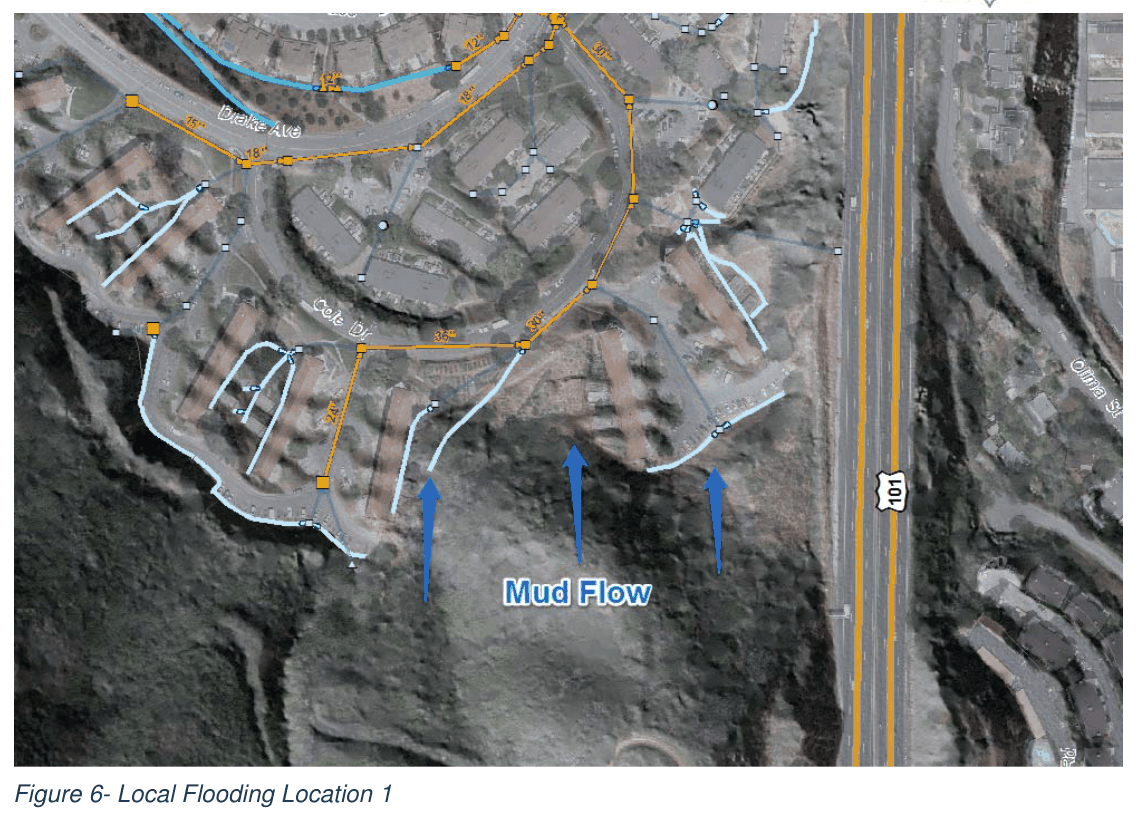
Figure 6: Local Flooding Location 1
Marin City Drainage Study, p. 13. Wood Rodgers, for Marin County Flood Control Zone No. 3, January 22, 2018.
Drawn over aerial imagery whose own license this project has not traced.
One of seven locations the 2018 study mapped in detail, with the mud flow marked. Seven years before the stormwater plan, at the same places.
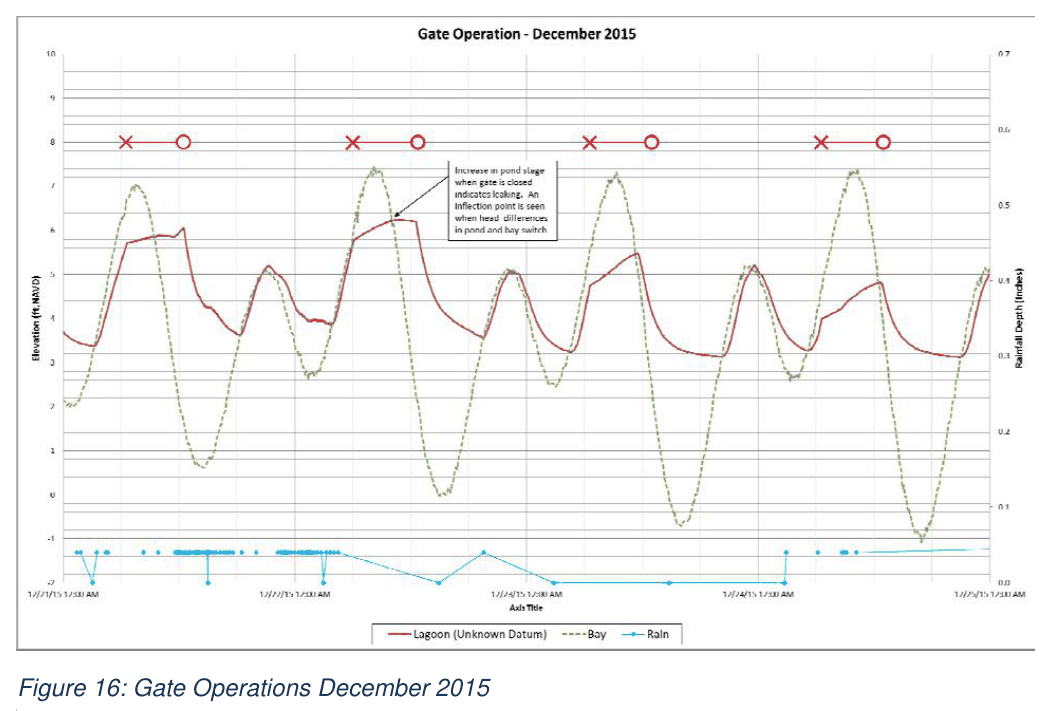
Figure 16: Gate Operations December 2015
Marin City Drainage Study, p. 27. Wood Rodgers, for Marin County Flood Control Zone No. 3, January 22, 2018.
Four days of the real gate being opened and shut by hand, against the tide and the level in the pond. This is the closest thing to observed data on the mechanism the whole site describes, and it is from 2015.
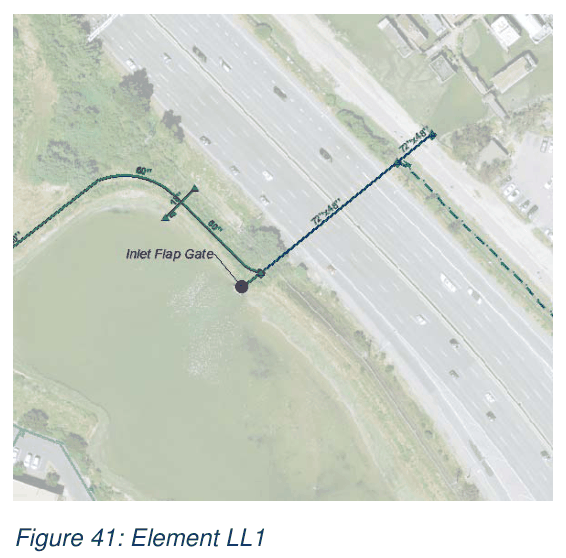
Figure 41: Element LL1
Marin City Drainage Study, p. 68. Wood Rodgers, for Marin County Flood Control Zone No. 3, January 22, 2018.
Drawn over aerial imagery whose own license this project has not traced.
One of the 2018 study's numbered fixes: a flap gate on the mouth of the pipe — a gate that shuts by itself when the tide pushes back, instead of by hand. Drawn in 2018; Caltrans' new culvert is designed with a duckbill check valve, the same idea.
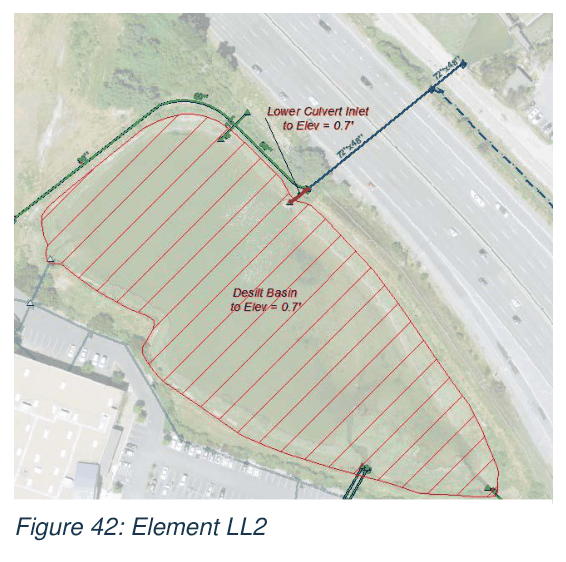
Figure 42: Element LL2
Marin City Drainage Study, p. 69. Wood Rodgers, for Marin County Flood Control Zone No. 3, January 22, 2018.
Drawn over aerial imagery whose own license this project has not traced.
Digging the silt out of the pond and lowering the mouth of the pipe back to the 0.7 ft it was built at. Drawn in 2018; residents named the silt the same year; the county documented it in 2025; federal money is now reported as going to it.
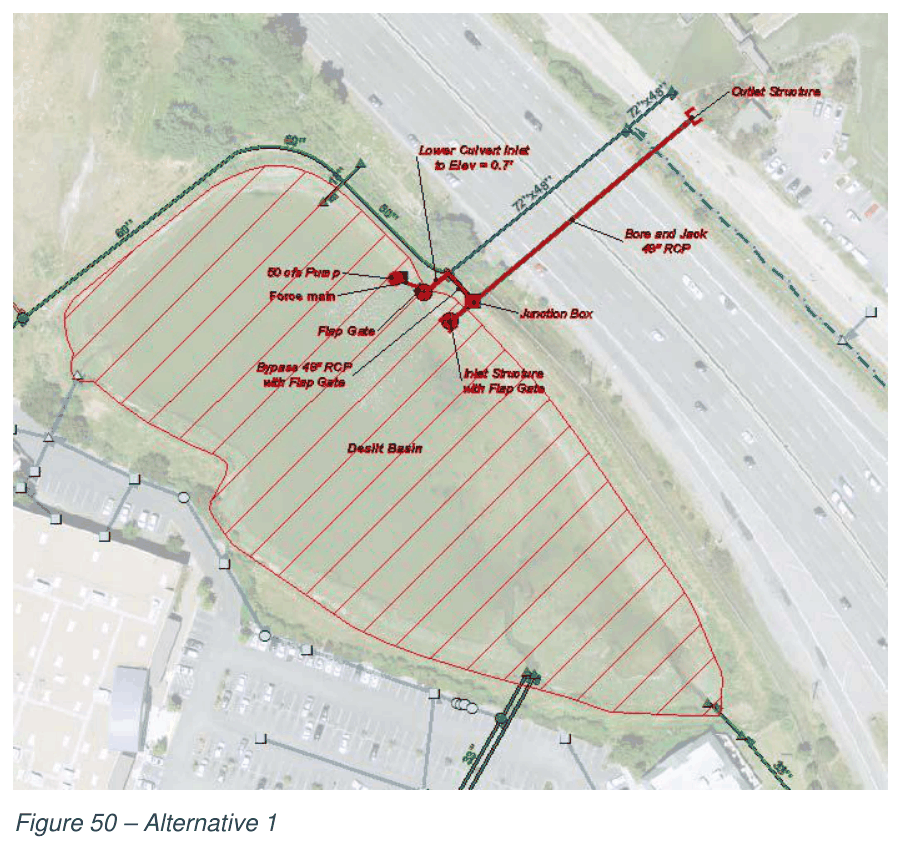
Figure 50: Alternative 1
Marin City Drainage Study, p. 78. Wood Rodgers, for Marin County Flood Control Zone No. 3, January 22, 2018.
Drawn over aerial imagery whose own license this project has not traced.
The most effective of the four whole-system packages priced in 2018: about $7.6 million, cutting the area flooded in what engineers call a 10-year storm (their yardstick for a big storm; see the glossary) from 16.4 acres to 6.4. Most of what is now planned is inside this drawing.
Photographs by the project team
The pond, the freeway and the bay · September 5, 2026
The project's own pictures, which is why they can be shown here
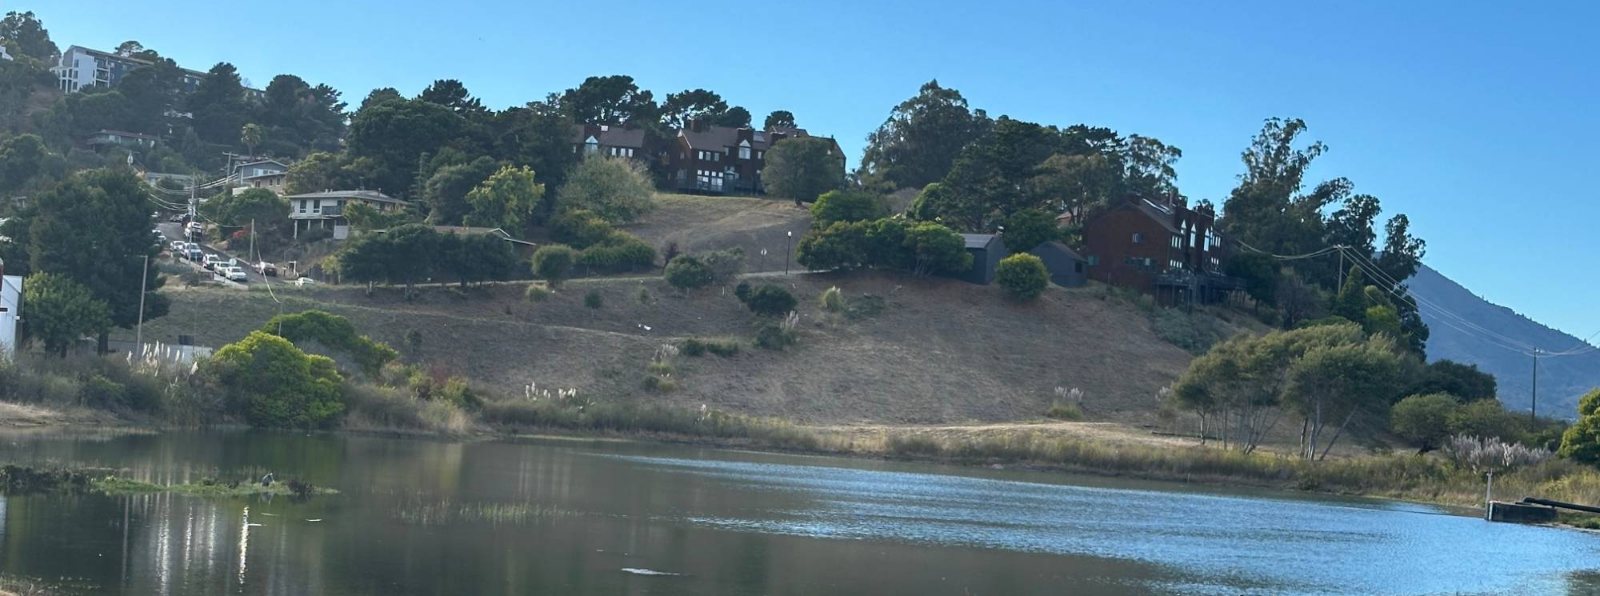
The pond, from its fence line: the low ground the whole bowl drains to, with the hillside behind it. The county calls it a detention basin, the wetland plan calls it a restoration site, and on a dry day it is this.
Photograph: the project team, September 5, 2026. The project team took these pictures, holds them, and publishes them here.
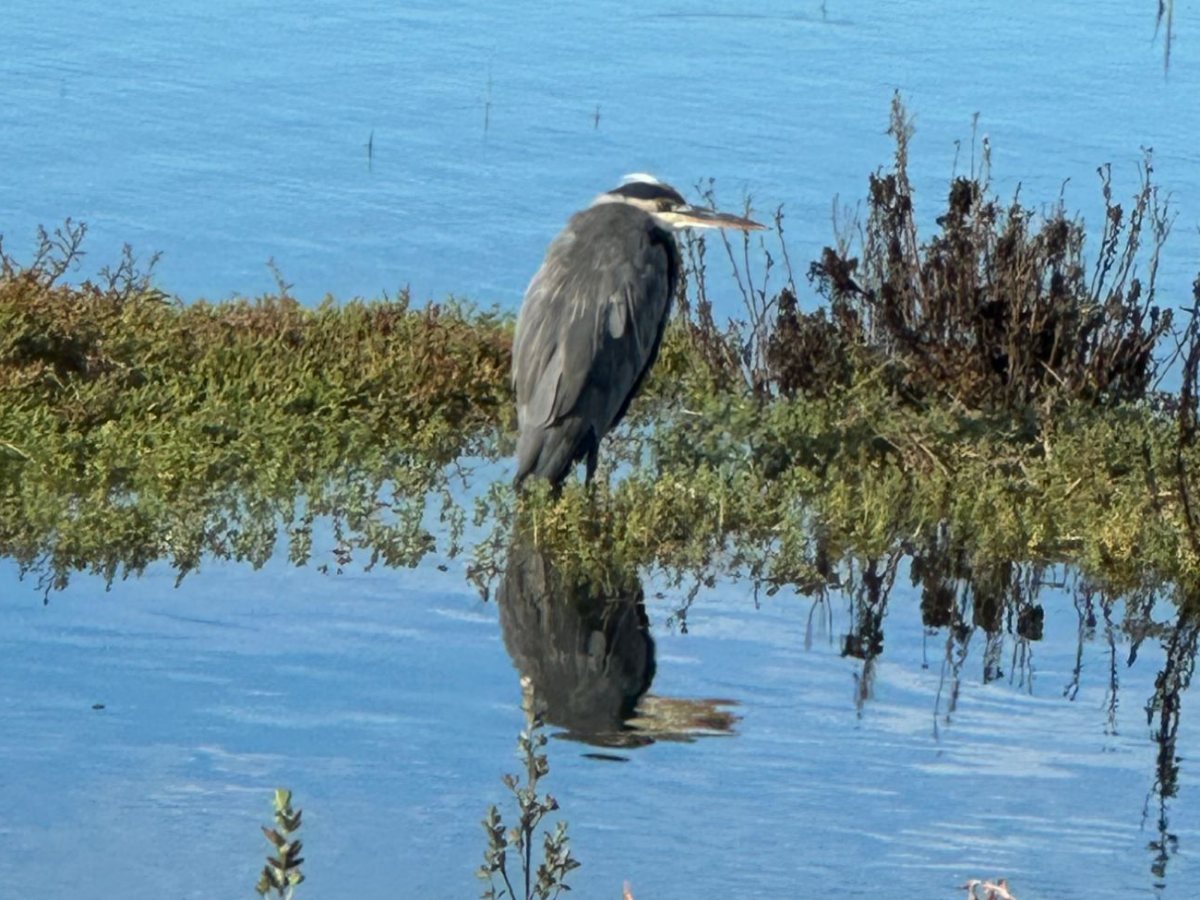
A great blue heron at the edge of the pond. The county's own plan calls the pond “a three-acre tidal marsh habitat”; on a still day, this is what that means.
Photograph: the project team, September 5, 2026. The project team took these pictures, holds them, and publishes them here.
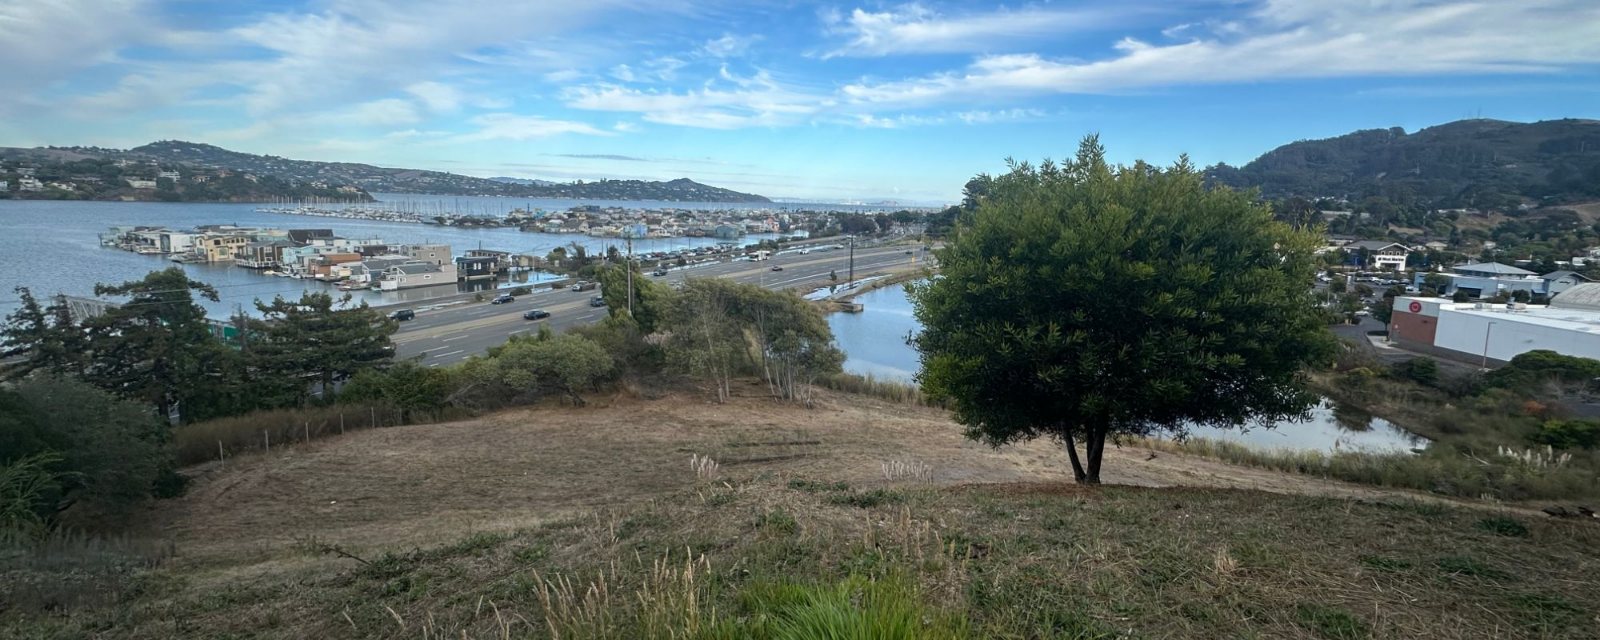
The whole mechanism in one frame, from the hillside: the pond at the bottom of the bowl (right of center, below the tree), Highway 101 on its bank, and the floating homes on Richardson Bay across it. Everything the home page tracker draws is in this picture.
Photograph: the project team, September 5, 2026. The project team took these pictures, holds them, and publishes them here.
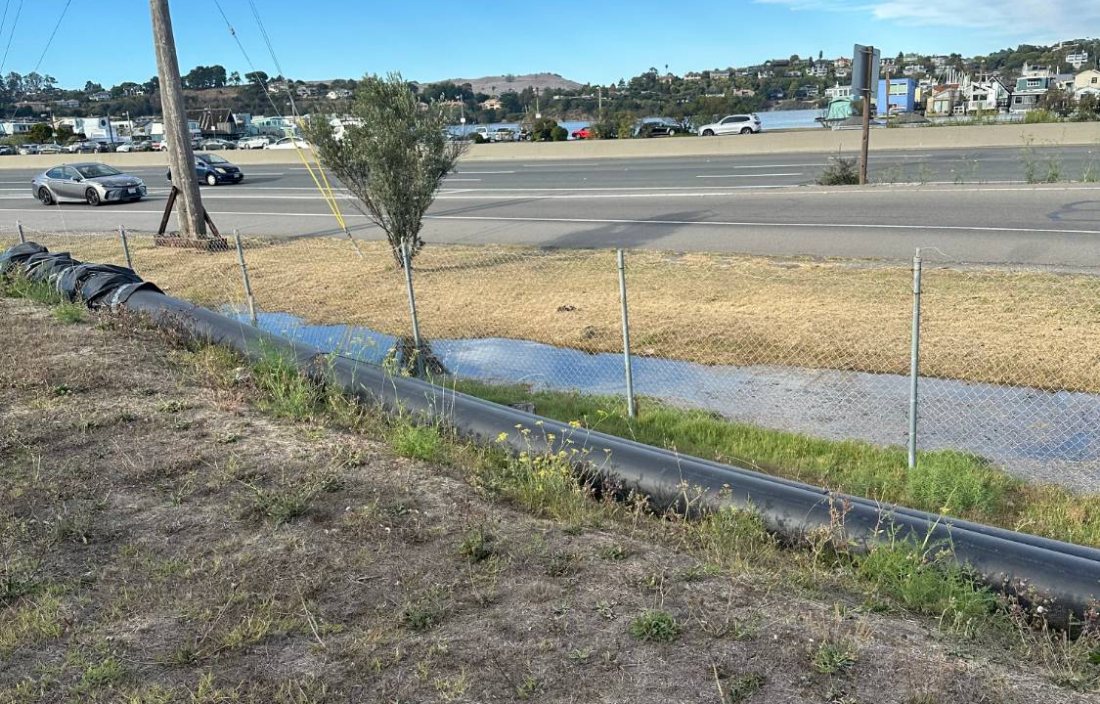
A black pipe along the fence at the pond's edge, with Highway 101 behind it and the floating homes across the bay; the project team describes it as the county's temporary pumping at the pond. A portable pump went in at Donahue Street in 2024 as an interim measure, and the permanent station is the first project in the county's 2025 plan. The picture cannot say which of those this pipe belongs to.
Photograph: the project team, September 5, 2026. The project team took these pictures, holds them, and publishes them here.
What the pictures show that the text does not
Three of these are worth more than a chapter
The October 2021 photograph. Brown water pouring over a wall while crews sandbag it. The color is what matters: that is most likely sediment coming off the hillside, the same material the county records as having silted the pond by about two feet. In 2018 the People's Plan traced it to the gullies above the neighborhood and said pipe work at the bottom would only hold until the hillside refilled it. This photograph is what that sentence looks like.
Gate Operations, December 2015. Four days of the real being opened and shut by hand, plotted against the tide and the level in the pond: the closest thing there is to observed data on the mechanism this whole site describes. It is from 2015, it sits inside a 317-page engineering study, and we have not seen it cited anywhere else.
The community issue map. Residents' own account of where things go wrong, mapped symbol by symbol. It is in the county's 2025 plan and it is the most under-used picture in any of these documents.